DS 2003: Communicating with Data
Fall 2026 · Mon/Wed/Fri · Sarah Groves · Syllabus · Computer setup guide · Canvas
Office hours: Fri 1–2 pm, Rm 437 (Sarah) · Wed 1–2 pm, Capital One Hub (Isabelle Lee, TA)
The published figures for the science visualization panel activity, one per paper. Compare each with the figure your group built from the cut-out panels. Figures are reproduced from the papers for teaching; see each paper for the full figure legend.
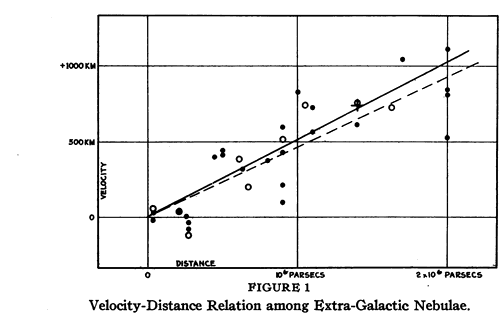
Hubble 1929: galaxies moving away
Story: The farther away a galaxy is, the faster it is moving away from us.
Hubble, E. (1929). A relation between distance and radial velocity among extra-galactic nebulae. Proceedings of the National Academy of Sciences 15(3), 168–173. doi:10.1073/pnas.15.3.168
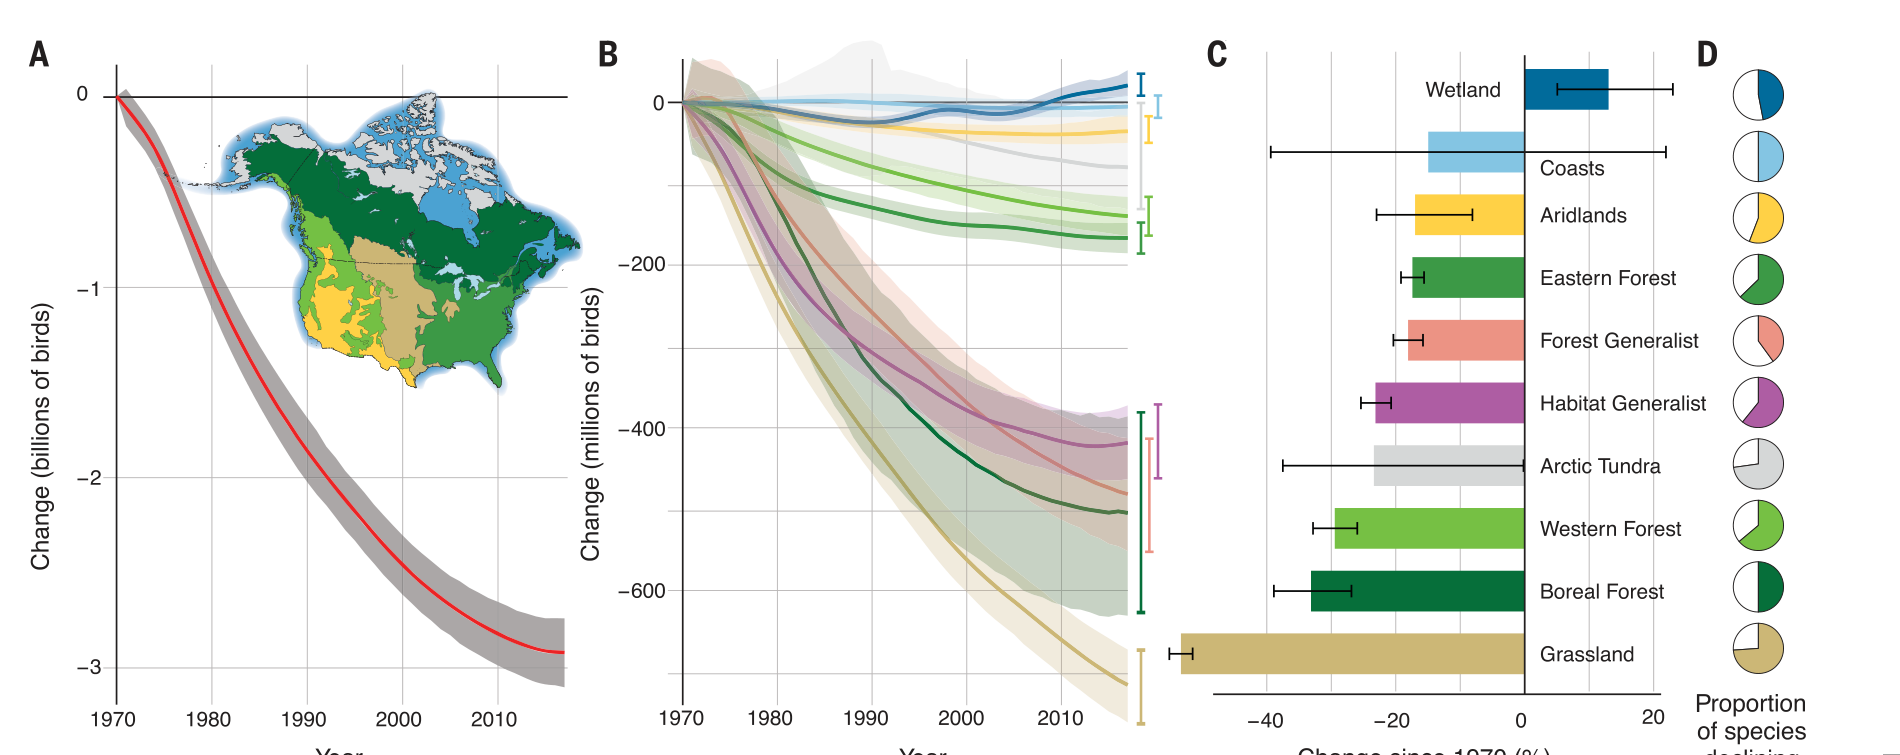
Rosenberg et al. 2019: North America's birds
Story: North America has about 3 billion fewer birds than in 1970, and the losses are mostly common, familiar species.
Rosenberg, K.V. et al. (2019). Decline of the North American avifauna. Science 366(6461), 120–124. doi:10.1126/science.aaw1313
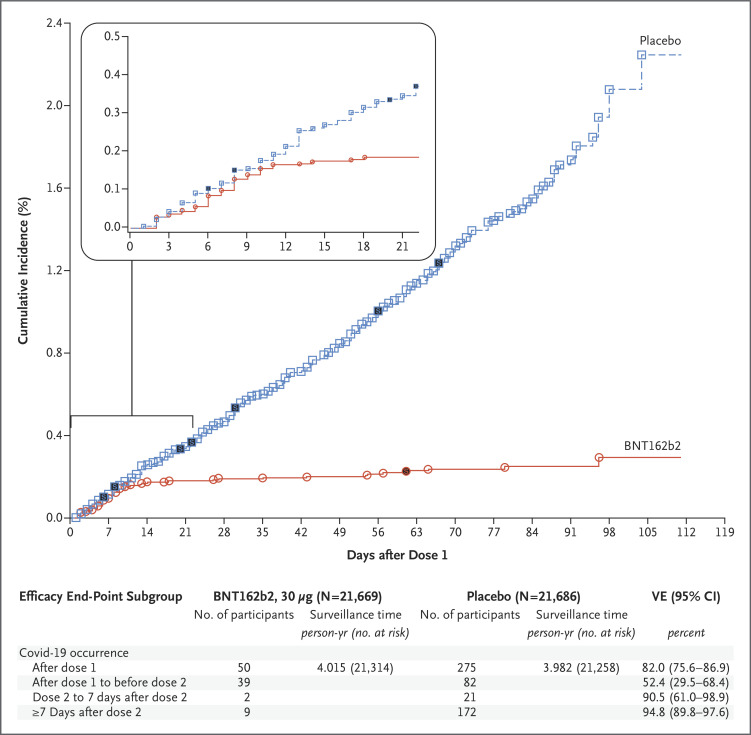
Polack et al. 2020: the Pfizer-BioNTech vaccine trial
Story: The vaccine prevented most COVID-19 cases, with protection beginning about 12 days after the first dose.
Polack, F.P. et al. (2020). Safety and efficacy of the BNT162b2 mRNA Covid-19 vaccine. New England Journal of Medicine 383(27), 2603–2615. doi:10.1056/NEJMoa2034577
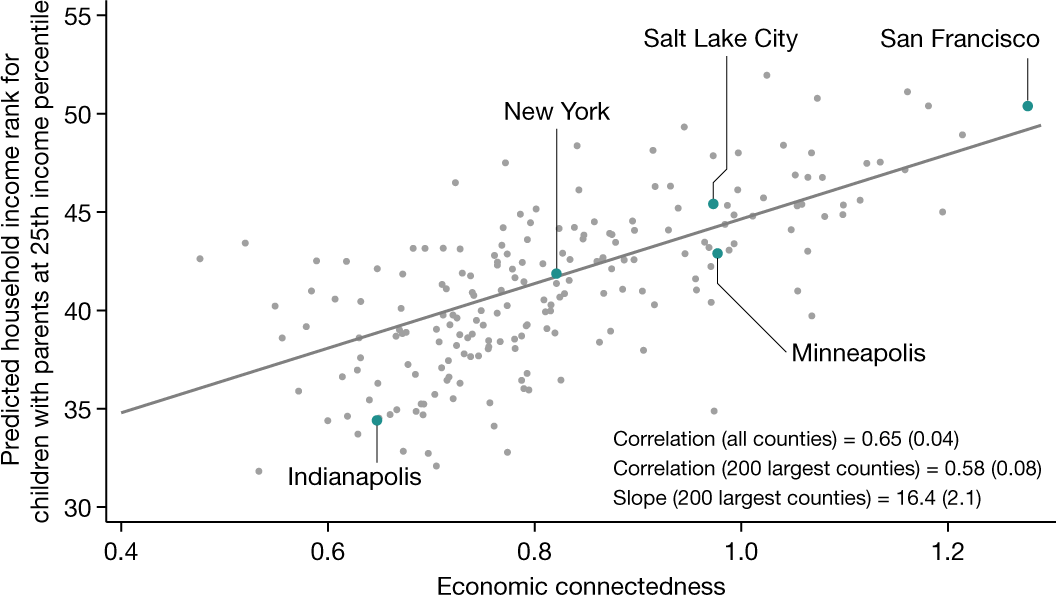
Chetty et al. 2022: friendships across income lines
Story: Kids from low-income families do better as adults in places where lower- and higher-income people are friends.
Chetty, R. et al. (2022). Social capital I: measurement and associations with economic mobility. Nature 608, 108–121. doi:10.1038/s41586-022-04996-4
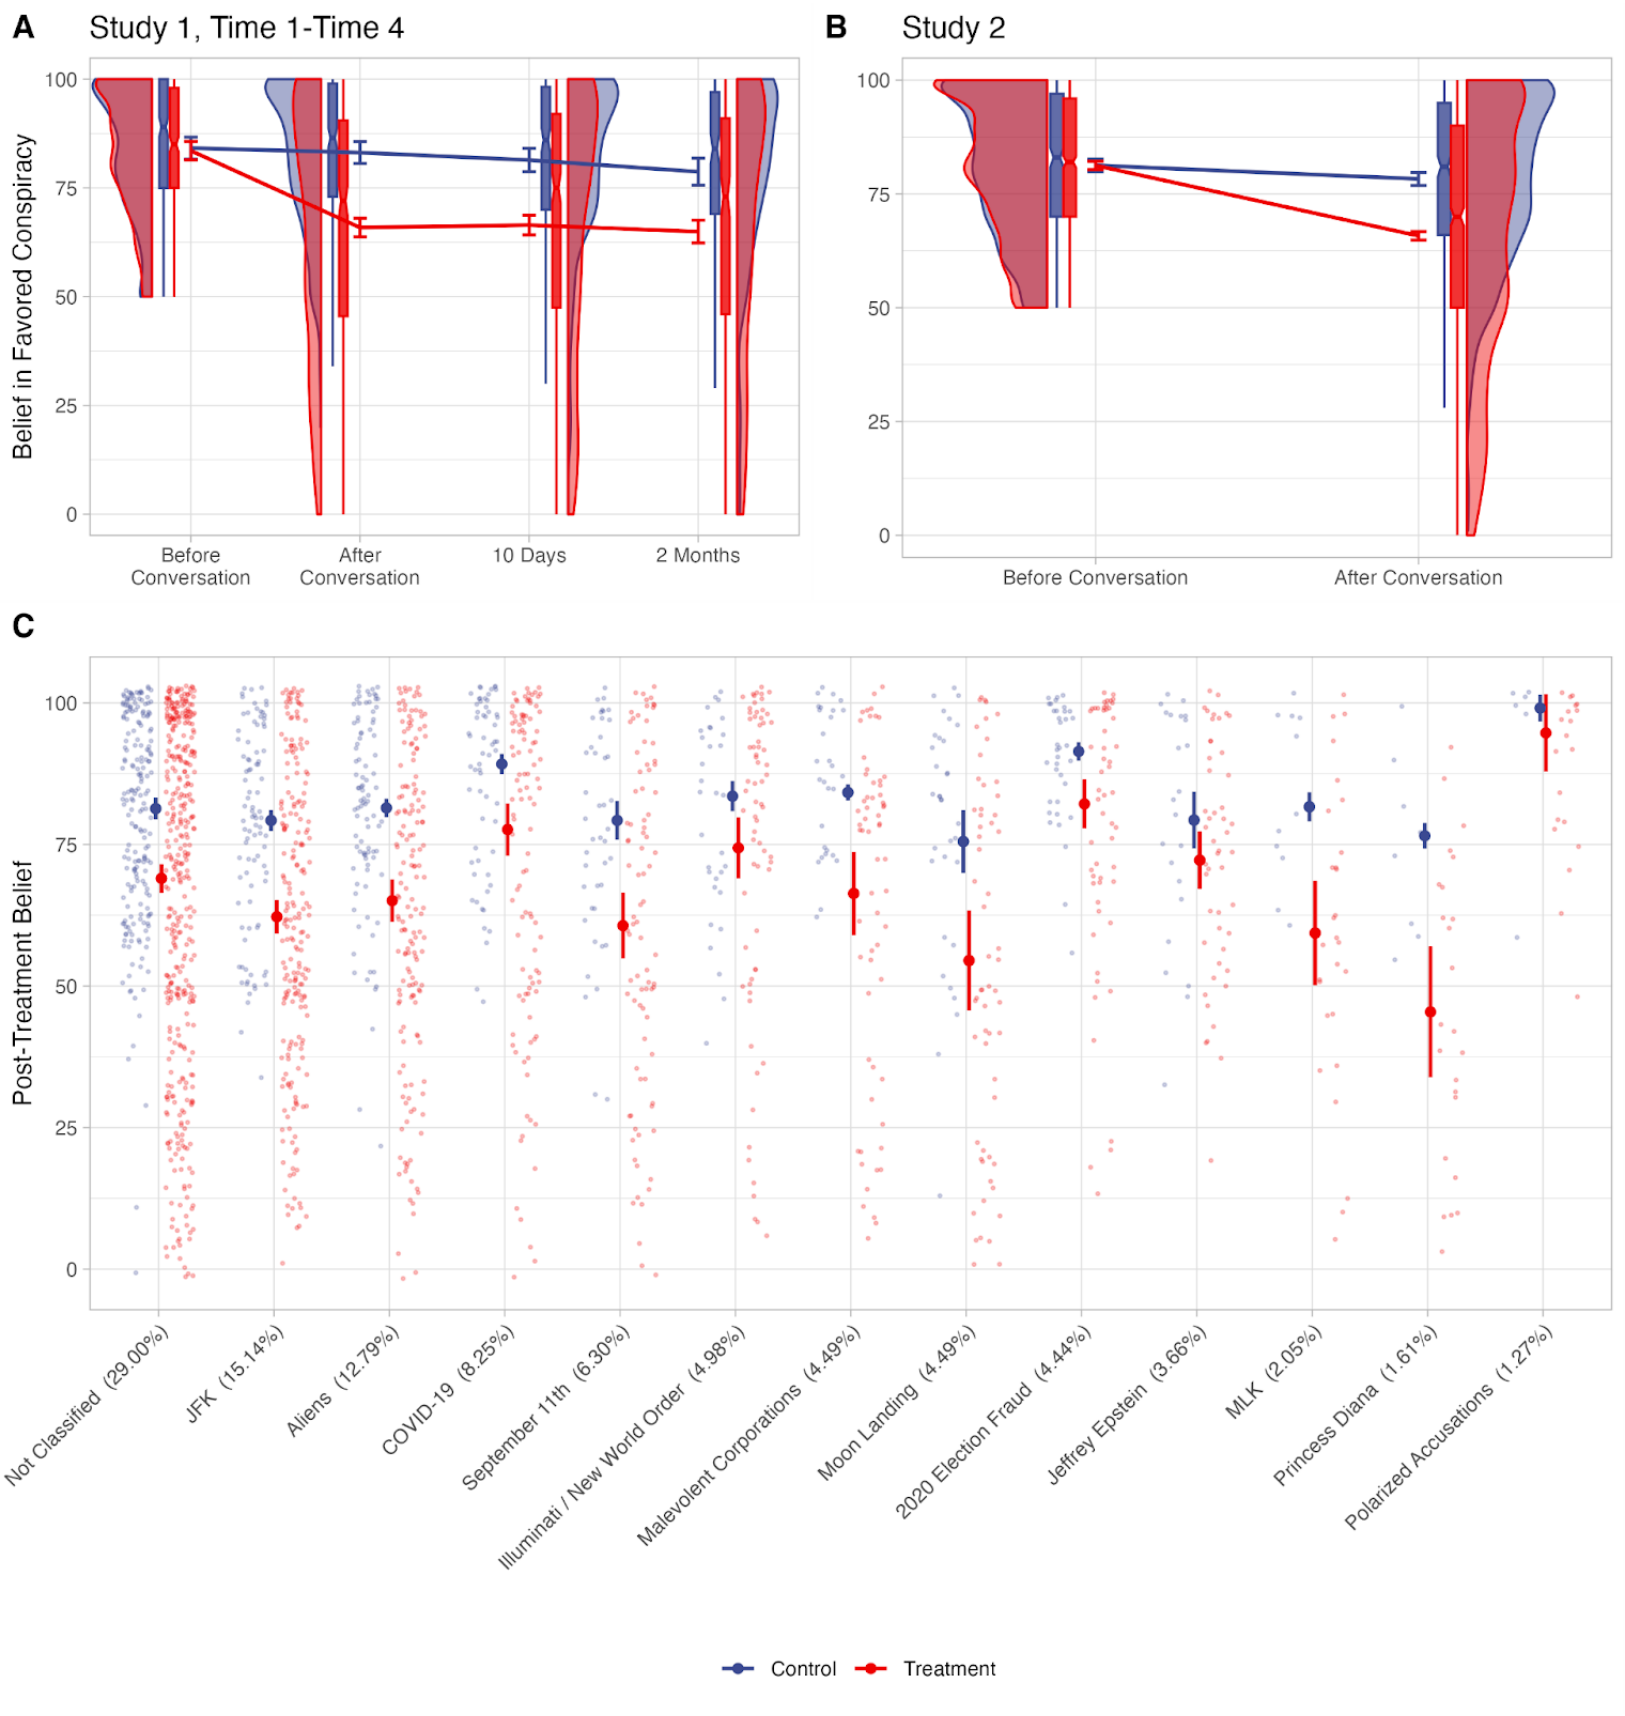
Costello, Pennycook & Rand 2024: talking with AI about conspiracies
Story: A short conversation with an AI chatbot made people believe a conspiracy theory they held less, and the drop was still there two months later.
Costello, T.H., Pennycook, G. & Rand, D.G. (2024). Durably reducing conspiracy beliefs through dialogues with AI. Science 385(6714), eadq1814. Some numbers were corrected in a 2026 erratum, Science 394(6822), eaem1178. doi:10.1126/science.adq1814
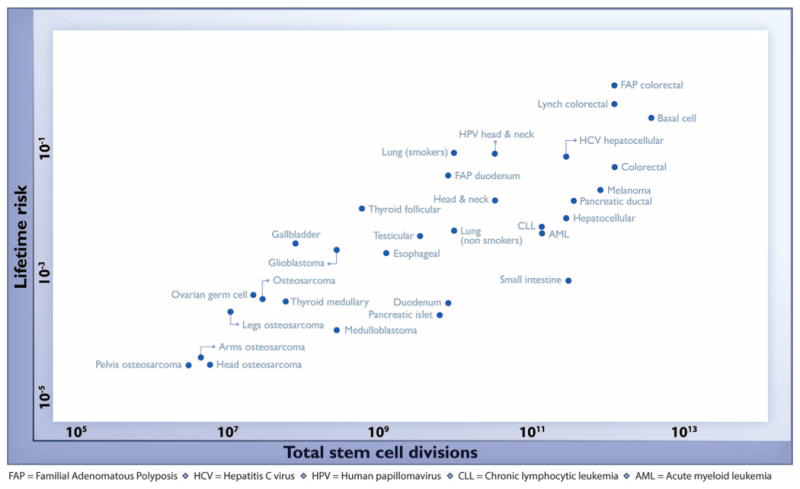
Tomasetti & Vogelstein 2015: stem cell divisions and cancer risk
Story: Body tissues with more total stem cell divisions over a lifetime (more stem cells, dividing more often) tend to have a higher risk of cancer.
Tomasetti, C. & Vogelstein, B. (2015). Variation in cancer risk among tissues can be explained by the number of stem cell divisions. Science 347(6217), 78–81. doi:10.1126/science.1260825
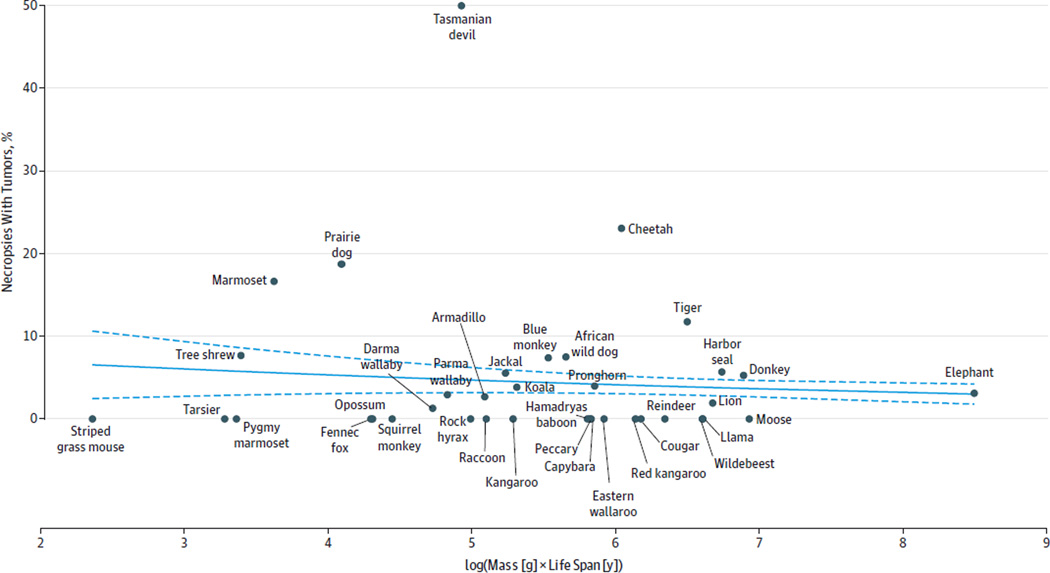
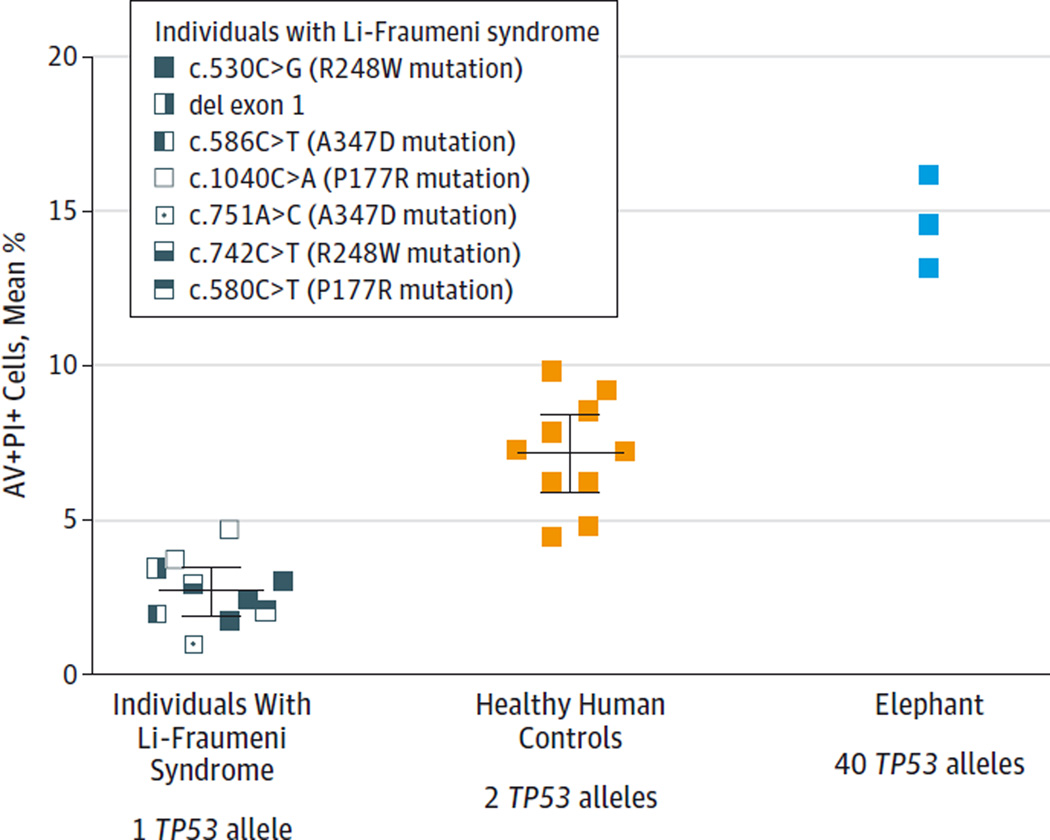
Abegglen et al. 2015: why elephants rarely get cancer
Story: Elephants die of cancer far less often than people, carry about 20 copies of the cancer-fighting gene TP53, and in lab tests their damaged cells died more readily.
Abegglen, L.M. et al. (2015). Potential mechanisms for cancer resistance in elephants and comparative cellular response to DNA damage in humans. JAMA 314(17), 1850–1860. doi:10.1001/jama.2015.13134
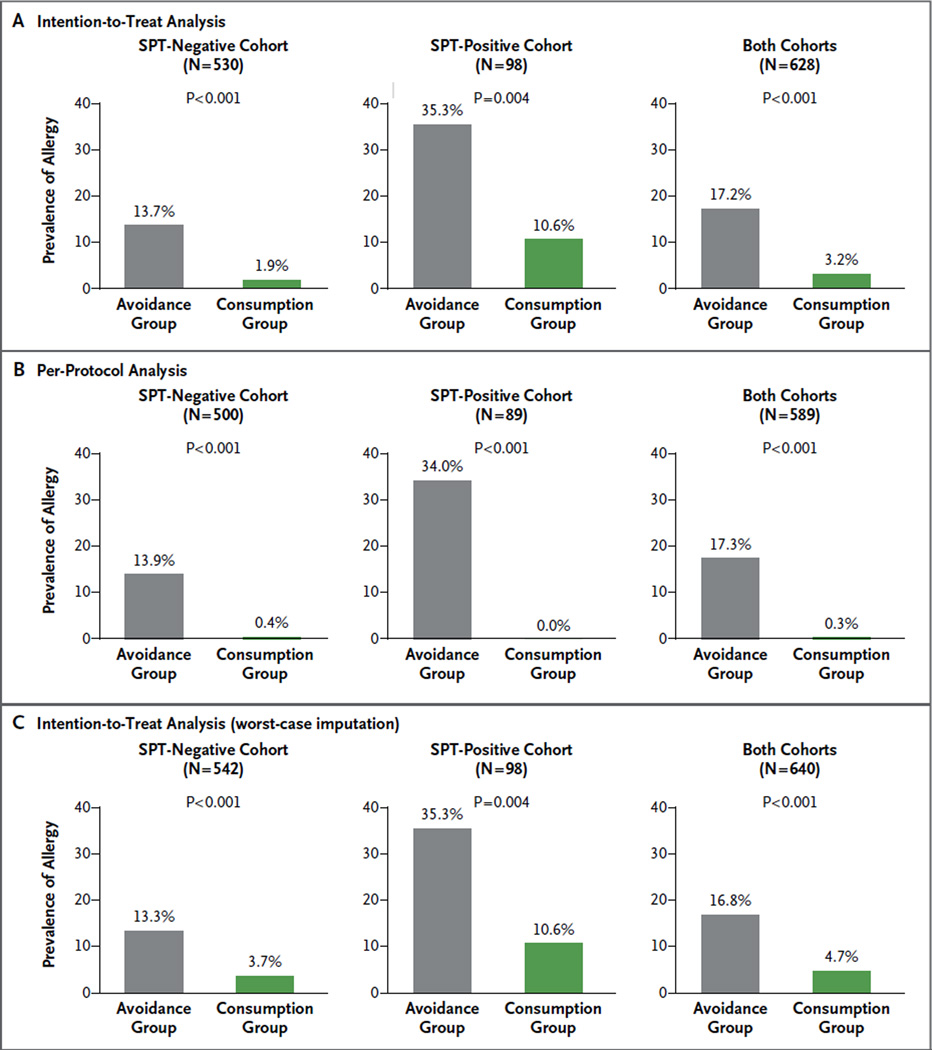
Du Toit et al. 2015: the peanut allergy trial
Story: Babies at high risk who ate peanut regularly were much less likely to have a peanut allergy at age 5 than babies who avoided it.
Du Toit, G. et al., for the LEAP Study Team (2015). Randomized trial of peanut consumption in infants at risk for peanut allergy. New England Journal of Medicine 372(9), 803–813. doi:10.1056/NEJMoa1414850